Cutting the Gordian Knot
“How long until it pays for itself?” is the wrong question to put to a software vendor. The right one is harder — and the only one that protects you. On proving supply-chain ROI with a method, not a slide.
From the diary of a weary supply-chain manager: freight to the final destination is too high — if I'm honest, I can't even calculate it properly. Sales spend their days firefighting instead of selling. Support spends its time chasing whether orders will arrive. I'd love to give customers a firm promised date — but the infrastructure to do it is expensive, and it's expensive today too. Ask a room of these managers to rank their goals, as one American survey did, and the top of the list is always the same: on-time delivery, shorter lead times, supply-chain flexibility, lower transport cost.
And the uncomfortable truth underneath all of it: the ERP everyone bought does not cure this. Supply-chain cost can run to 20% of the consumer price — and the highest cost of all is the one nobody books, the sale lost because the goods reached the shelf too late and the customer went to a competitor.
The question behind the questionTo ROI or not to ROI
Closing that gap means buying tools that bolt onto the ERP and onto everything around it — purchasing, distribution, sales, shipping — and integrating them. That is not a trivial spend: it is concept, organisation and method, years of interfaces, and years of upkeep. So the manager asks the vendor the natural question — “I just want to get home safely; how long until this pays for itself?” — and waits for a number.
That number, on its own, is worthless. A superficial question earns a superficial answer; a deep one asks for something else entirely. As the fox tells the Little Prince, “it is only with the heart that one can see rightly; what is essential is invisible to the eye” — the things that matter here are hidden from view, and it is no wisdom to follow only what the eye can see. So don't accept the figure. Ask instead: what is the ROI model behind it?
Don't ask what the ROI is. Ask to see the model that produced it — and whether it maps to your pain.
Because one shouldn't compare an organisation that flies electronic parts by air with a pharma company shipping pallets of painkillers out of Israel, through Liège, to Moscow. Each hurts a different pain. A model that can't tell them apart is a story, not a measurement — and no beginning painter on the banks of the Seine would rush to put it on canvas.
The vocabularyFour words that make it real
A usable model rests on four plain ideas — demand them by name:
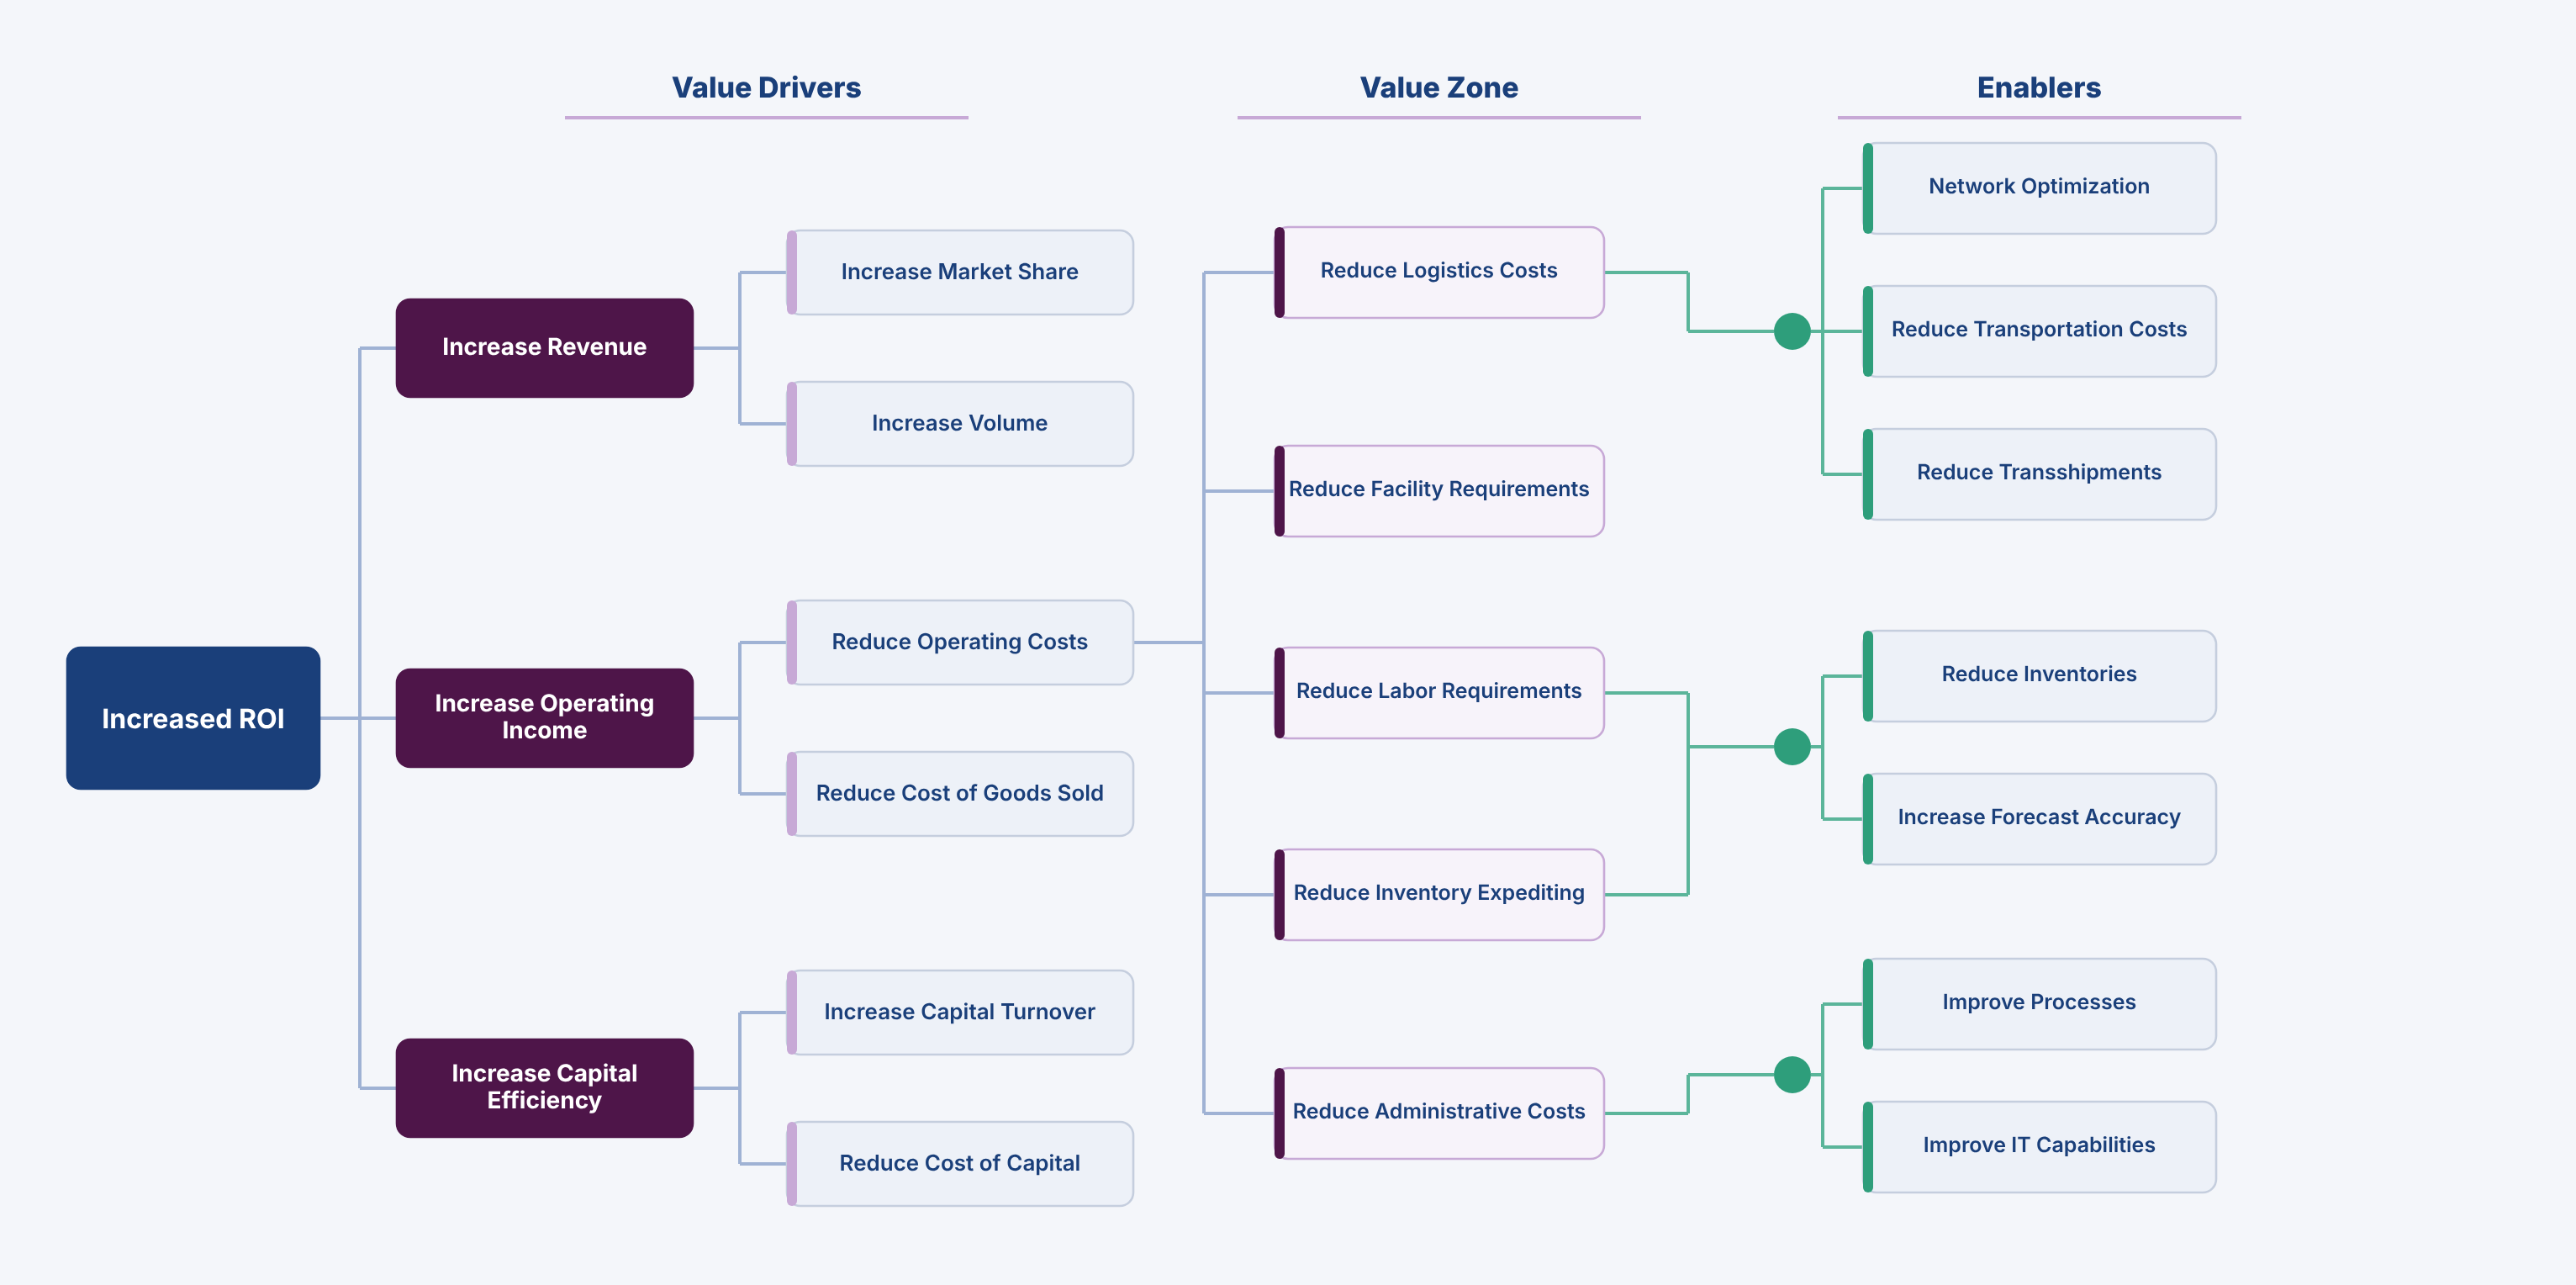
- Value drivers — the areas that, if genuinely improved, move the ROI: more revenue, more operating income, better capital efficiency.
- Value zones — the specific places the gain actually comes from: reduce logistics cost, reduce facility and labour need, reduce inventory expediting, reduce administration.
- Enablers — the concrete actions that drive a zone: network optimisation, lower transport cost, fewer transshipments, better forecast accuracy, improved processes and IT.
- KPIs — the indicators that let you measure it, so you present numbers instead of telling stories on slides.
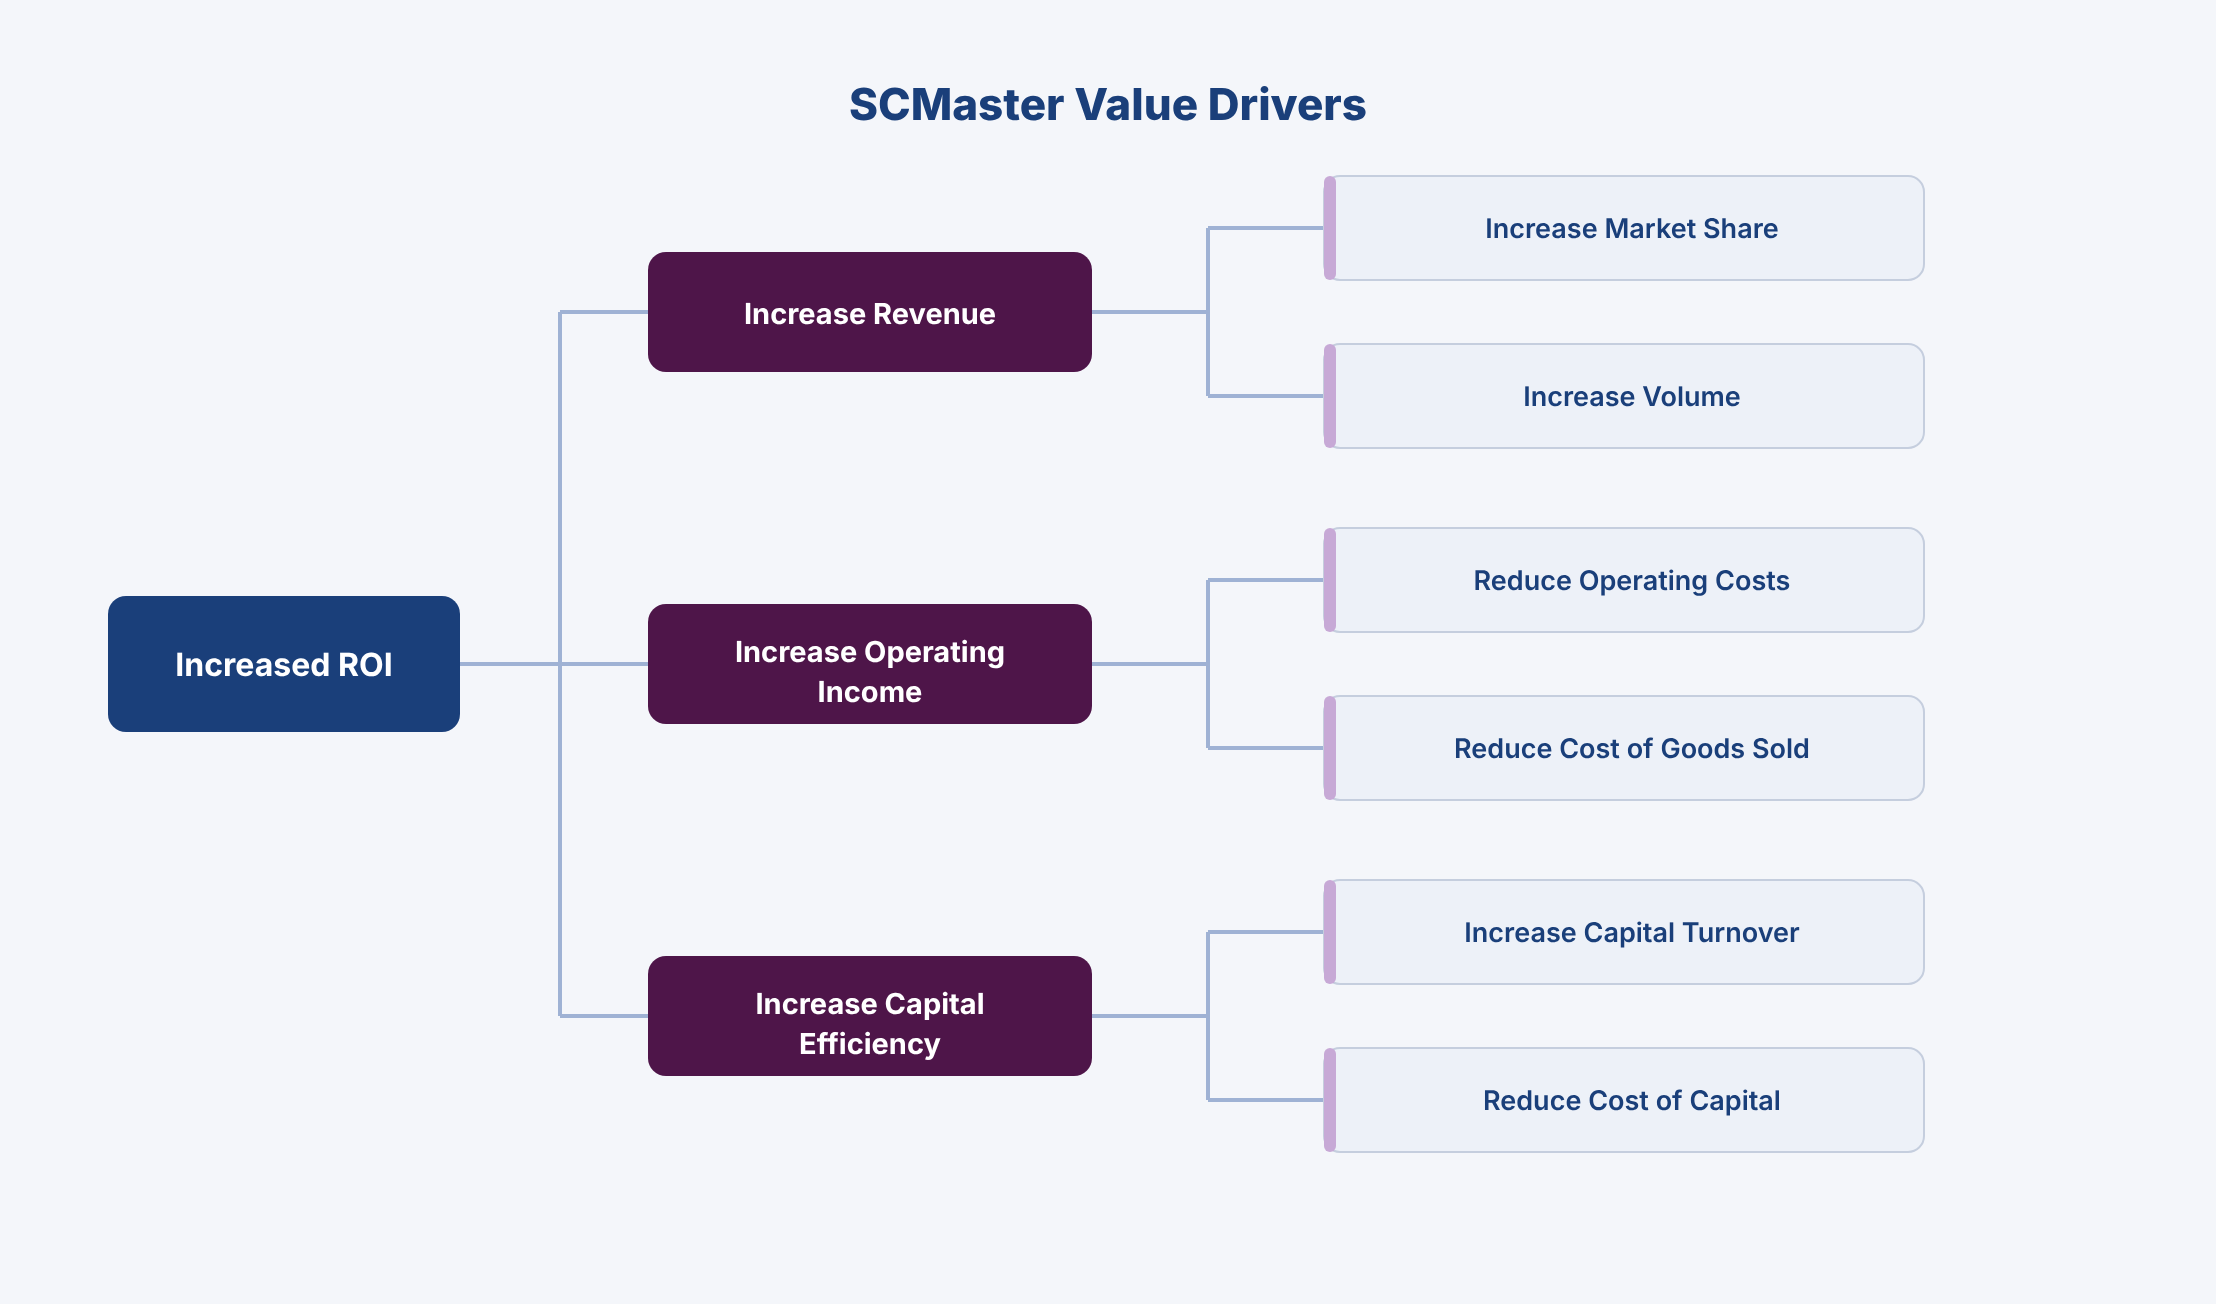
Everything ultimately serves one interest — the shareholders. You raise revenue, or you raise operating income (raising turnover while expenses climb alongside it, in the trade's own words, “doesn't count”), or you raise capital efficiency. But a value driver stated at that altitude is still too abstract to act on. “Reduce operating cost” is not a plan. You have to go down a resolution, and then another.
Bringing it to the groundA worked example
Take one thread all the way down. Once a year you tender international freight, several carriers against each other. Comparing a single lane — air, JFK → FRA, 100–250 kg — is tedious but easy: column A against column B. What you can't easily see is your own annual volume on that lane and what you actually paid last quarter, last half, last year. That is the enabler: analytics (call it BI) that hands you your own history before you walk into the negotiation.
So ask the customer plainly: “Given your yearly volumes, read across twelve analysis dimensions, how much do you think better data would improve your bargaining?” The honest answer is usually a shrug and “maybe 5%.” Fine. If freight is $1,000,000 a year (the KPI), then that 5% — negotiating power (enabler) bearing on shipping cost (value zone), lowering operating cost, lifting operating income (the value driver) — is $50,000 a year. Fifty thousand real dollars. And to earn that same $50,000 in operating profit at a 20% margin, the company would have to sell a quarter of a million dollars of product. That is the knot — endless, tangled — and this is the sword that cuts it: not rhetoric, but one measurable enabler tied to one KPI.
Scenarios and sensitivitiesConservative, likely, aggressive
One number is a guess; a defensible model gives a range. Lay out three scenarios — conservative, most likely, aggressive — each carried through to gross savings, to savings in NPV terms against a known hurdle rate, and above all to payback in months. That is what a buyer can actually weigh.
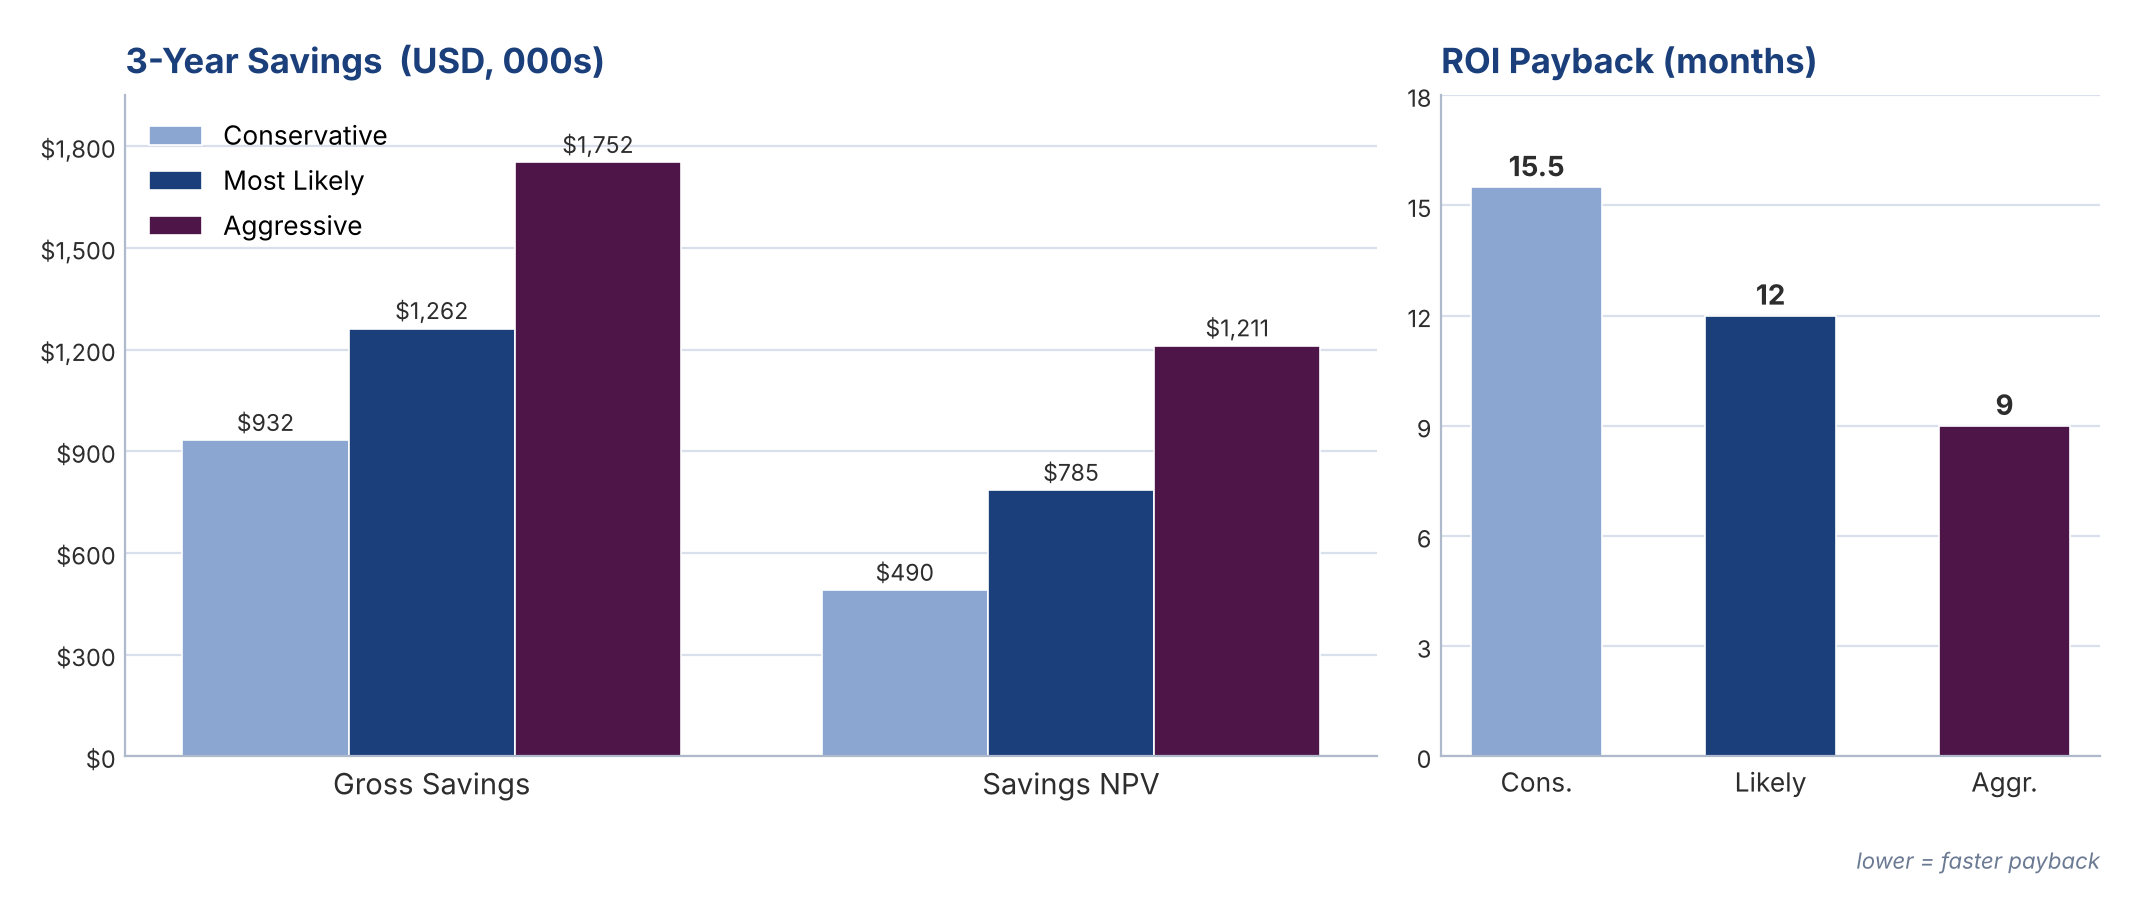
Ground it in one capability. The system spots that a small, urgent shipment is riding an express courier when it could travel consolidated with a freight forwarder — and routing it the cheaper way can save up to four times the planned cost. Now put the sensitivity on it. Say premium freight is $500,000 a year. In the conservative case the customer shifts just 2% of it — $10,000 of opportunity — and because the premium-to-consolidated ratio is about 4:1, roughly $8,000 is real saving (the forwarder still takes $2,000). In the aggressive case — 4%, which any buyer calls “easy” — gross saving is $20,000 and net about $16,000. To earn that $16,000 at a 10% gross margin, you'd need to sell $160,000. And that is on half a million of premium freight; double the freight and you double the prize.
None of this is magic, and none of it is a story on a slide. It is the discipline of refusing the glib payback number and insisting on the model underneath — the drivers, the zones, the enablers, the KPIs — until the knot comes apart in your hands.
“Things have a life of their own. It's simply a matter of waking up their souls.”
— Gabriel García Márquez. In our case, software — but with a soul.
With thanks to the supply-chain managers, import–export leads and budget controllers — at electronics manufacturers, a components importer and a pharmaceutical shipper, whose names we keep, gratefully, on file — who argued these models to the ground with us.